De bedoeling is om bij een opsomming een pijl te laten meebewegen per afgehandeld punt.
Dit kan je op verschillende manier realiseren, de eerste methode is gebruik maken van een pijltje bij ieder opsompunt en te werken met animaties.
De bedoeling is om bij een opsomming een pijl te laten meebewegen per afgehandeld punt.
Dit kan je op verschillende manier realiseren, de eerste methode is gebruik maken van een pijltje bij ieder opsompunt en te werken met animaties.
Je kan in PPT een video maken van je presentatie. Daarvoor kies je in Bestand voor Exporteren en vervolgens Een video maken. Daarbij kan je kiezen voor de optie Seconden besteed aan elke dia.

Die instelling is alleen van toepassing op dia's waarvoor geen timing is ingesteld in de presentatie. Als je de optie "Opgenomen timings en gesproken tekst gebruiken" kiest, bepalen de bestaande timings wat er naar video wordt geëxporteerd. Timings opnemen doe je via het tabblad Opnemen en de knop Opnemen. Of via tabblad Diavoorstelling - knop Tijdsinstellingen voor try-out/ of knop Opnemen.


Als er geen opgenomen timings zijn of er zijn tenminste enkele dia's zonder timings opgenomen, dan moet er een standaard timing zijn zodat de presentatie niet vastloopt op de eerste dia die geen timing heeft. De optie seconden besteed aan elke dia staat standaard op 5 seconden.
Kortom, met de twee opties (Geen opgenomen timing en gesproken tekst en seconden besteed aan elke dia) kun je kiezen tussen het instellen van specifieke timings of het gebruik van dezelfde looptijd voor elke dia.
If you want to see multiple slides at the same time you have to choose the slide sorter button in the status bar.


Als je meerdere dia's tegelijkertijd wil zien maak je gebruik van de diasorteerder. Daarvoor klik je in de statusbalk op het knopje diasorteerder.

The intention is to have an arrow move along with each item
dealt with during a bulleted list.
You can achieve this in different ways, the first method is to use an arrow next to each bullet point.
With multiple arrows and start and end animations.
Here's the slide with all the arrows.

Below you can see the animation pane where all bullet points are immediately visible. The first arrow appears automatically. The others only need one entrance effect and one exit effect.

Here's the animation pane where each bullet point and each arrow is animated individually. You apply two opening and one ending animation for each bullet point except for the first bullet point where you apply two opening effects.

Two illustrative videos:
With one arrow and using motion paths
That is a bit more difficult and requires some preparation. This time we will use only one arrow.
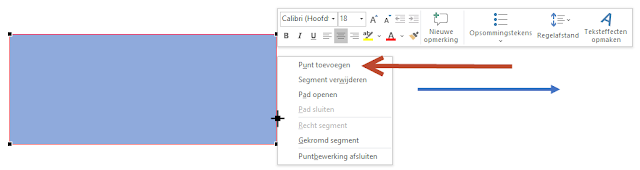
Draw your list arrow first and place it next to the first bullet point.
Press the combination Alt+F9 to make the guides visible.
Copy the horizontal guideline by pressing the Ctrl key and dragging with the
double arrow (see Fig.).

Position the extra guideline exactly where you want it. Repeat for the other bullet points. Optionally, also draw a vertical guide to help position the motion path.
Select the arrow, choose the Animations tab and the Add animation button, choose More motion paths at the bottom. In the Lines and Curves section, select the Down animation.
Drag the red end point up to the height of the set guideline. Make use of the vertical guideline to position correctly.

Select the arrow again and add an animation down to it as described above.
The animation starts at the height of the first bullet point and will therefore have to be moved. Drag the green circle (beginning of themotion path) to the end point of the first animation path.
Drag the red circle (endpoint of the motion path) to the correct height of the third bullet point.
Repeat for the next bullet points, possibly starting with the red end point if the start and end points are too close to each other.
This is the end result:


Here's a video illustrating the procedure:
This method is by far the simplest. The only downside is that you need several slides for it.
Create your first slide and place the arrow next to the first bullet point.
Duplicate the slide 4 times by right clicking on it and
choosing Duplicate slide from the quick menu.
On the copies you simply move the arrow to the next bullet point. The guides will facilitate the work.
Finally, select slides 2 through 5. Go to the Transitions tab and select the Morph transition.

Kies het tabblad Ontwerpen op het lint.
Klik in de groep Aanpassen voor de knop Diagrootte.
Kies onderaan Aangepaste diagrootte.


Click the Design tab on the ribbon.
Choose the Slide size button in the Customize group.
Choose Select custom slide size.
At the bottom next to Number slides from choose 0


By default slide numbers are printed when printing handouts. You can avoid this by choosing an option in the print dialog. File - Print - under slides choose the number of slides you want to print on each page of the handouts.
Remove the check next to Print slide numbers on handouts at the bottom if you do not want this.

You can avoid printing the numbers altogether by going to File - Options - Advanced - Print - remove check next to Print slide numbers on handouts.
Handout dia's worden standaard met een dianummer afgeprint.
Je kan deze optie uitschakelen ga naar Bestand - Afdrukken - kies onder dia's hoeveel dia's je per bladzijde op de handouts wil afdrukken.
Vink onderaan de optie Dianummers afdrukken op handouts uit als je geen dianummers onder elke dia wil.

Je kan de optie ook permanent uitschakelen. Ga naar Bestand - Opties - Geavanceerd - Afdrukken - en haal het vinkje weg bij Dianummers afdrukken op handouts.
Een weinig gekende nieuwigheid in PPT 2019-2021 is het slim kopiëren van objecten.
Na het invoegen van een object bv een rechthoek kopieer je de rechthoek met de combinatie Ctrl+D. Positioneer dan de gekopieerde rechthoek tot die op de ideale afstand terechtkomt en laat hem geselecteerd.
Druk nu opnieuw Ctrl+D en herhaal dat zoveel als nodig, alle objecten komen op dezelfde hoogte met dezelfde afstand als tussen de eerste twee.
A little-known novelty in PPT 2019-2021 is the smart copying of objects.
After inserting an object eg a rectangle, copy the rectangle with the combination Ctrl+D. Then position the copied rectangle until it lands at the ideal distance and leave it selected.
Now press Ctrl+D again and repeat as much as necessary, all objects will be at the same height with the same distance as between the first two.
If you want to zoom in on a slide during your presentation you can use different techniques. More on this in my article:
But you can also make use of the Windows 10/11 magnifier.
To activate the magnifier press Windows key + +key. By default zoom is on 100%

If you want to zoom in further press the same combination again, each step increases the zoom with 100 %.
If the step is too large you can change this in the settings of the app. Use the Windows start button, Settings, Ease of access, Magnifier.
Change the percentage under Change the zoom increments.

By default magnifier works on the full screen, you can also use a zoom window or fix it on the screen. To switch between modes use the combination Ctrl+Alt+M.
Finally you can use the read from here function.

By default magnifier follows the mouse pointer but you can choose the keyboard focus, the text cursor, or the narrator cursor.

Use the windows key + esc to deactivate the magnifier.
Als je wilt vermijden dat een gebruiker objecten kan verplaatsen of van grootte veranderen moet je die objecten vergrendelen. Dit is van toepassing op vormen, pictogrammen, 3D modellen enz...
Om een object te vergrendelen klik je erop met je rechtermuisknop. In het snelmenu kies je voor de optie vergrendelen.


Opmerking!
Wanneer je een tijdelijke aanduiding in het diamodel vergrendeld zal dat geen enkel effect hebben op de dia's. Men zal dus nog altijd kunnen verplaatsen of editeren op de dia.
If you want the user to not be able to move or resize objects in PPT you can lock them. This applies to shapes, icons, pictures, 3D models, connectors etc...
To lock an object, right-click it and then click Lock on the shortcut menu (suitable when there are not a lot of objects)

Or activate the Selection Pane by pressing Alt+F10 and then click the Lock icon to the right of the object name (suitable when there are a lot of objects). To unlock click the icon again.


Remark!
Be aware that locking placeholders in the master will have no effect on the slides. People will still have the opportunity to move or edit the slides.
Heb je voor een specifieke presentatie/sjabloon een aantal functies constant nodig dan kan je overwegen om deze functies aan de werkbalk snelle toegang toe te voegen enkel voor de huidige presentatie of sjabloon.
Klik op het lijstpijltje naast de werkbalk voor snelle toegang. Kies voor Meer opdrachten.

Bovenaan in de kolom werkbalk snelle toegang wijzingen kies je voor het lijstpijltje en je selecteert De huidige presentatie in plaats van Voor alle documenten - standaard.

Vervolgens kies je uit de lijst met opdrachten wat je nodig hebt en je voegt ze toe via de knop Toevoegen. De extra knoppen worden wel helemaal achteraan toegevoegd aan de werkbalk.

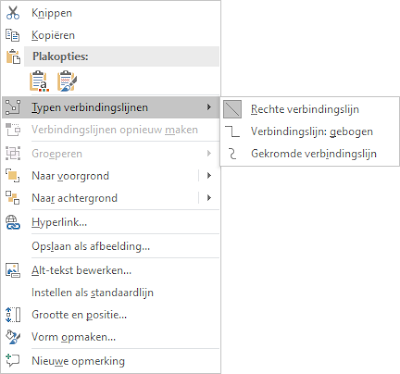
Standaard verbindingslijnen
Ga naar Invoegen - Vorm en kies bij de rubriek Lijnen voor deze mogelijkheden/types: