27 januari 2021

Difference between content placeholder and picture placeholder - PPT 2019

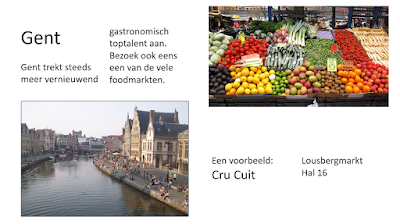
The difference lies in the behaviour of the placeholders. When you insert a photo into a content placeholder, the placeholder changes to fit the photo. If the photo is smaller than the placeholder, you get a lot of free space around it.

When you insert a photo into a picture placeholder, the picture adapts to the placeholder. The smallest size of the image fills the width/height of the placeholder, the longer size of the image is cropped.

To illustrate this, I added the same image to two slide layouts, the Title and content layout and the Picture with Caption layout.


This is the original picture, pay special attention to the roof of the house:


This is the photo on the two slide layouts:


No more roof on the house.

So the bottom line is that you use a content placeholder if you want to make sure the 'full' image is included. You use a placeholder for pictures when the dimensions of the images have to be constant across the slides without taking into account the images used.

If the result is not satisfactory, you can still move the photo within the placeholder.

Below is an example of a photo that has shifted vertically. Right-click on the image and choose Format picture. Click the Picture button in the task pane and move the image's position in the x-axis or y-axis under crop.


22 januari 2021

Verschil tussen een tijdelijke aanduiding voor inhoud en een tijdelijke aanduiding voor afbeeldingen - PPT 2019

Het verschil zit hem in het gedrag van de tijdelijke aanduidingen. Wanneer je een foto invoegt in een tijdelijke aanduiding voor inhoud wordt de plaatsaanduiding aangepast aan de foto. Als de foto kleiner is dan de tijdelijke aanduiding krijg je veel vrije ruimte errond. 

Wanneer je een foto invoegt in een tijdelijke aanduiding voor afbeeldingen past de afbeelding zich aan aan de tijdelijke aanduidingDe kleinste afmeting van de afbeelding vult de breedte/hoogte van de tijdelijke aanduiding, de langere afmeting van de afbeelding wordt bijgesneden.

Om dit te illustreren heb ik dezelfde afbeelding aan twee dia-indelingen toegevoegd nl. de indeling Titel en object (links) en de indeling Afbeelding met bijschrift (rechts).


Dit is het origineel, let vooral op het dak van het huis:


Dit is de ingebrachte foto op de twee dia-indelingen:

Geen dak meer te zien op de tweede foto.

De conclusie is dus dat je een tijdelijke aanduiding voor inhoud gebruikt als je zeker wilt zijn dat de 'volledige' afbeelding wordt opgenomen (de afbeelding wordt dus automatisch geschaald). Een tijdelijke aanduiding voor afbeeldingen gebruik je wanneer de afmetingen van de afbeeldingen constant moeten zijn over de dia's heen zonder rekening te moeten houden met de grootte van de gebruikte afbeeldingen.

Als het resultaat niet naar wens is kan je de foto nog verschuiven binnen de tijdelijke aanduiding.

Hieronder een voorbeeld van een foto die verticaal is verschoven. Klik met je rechtermuisknop op de afbeelding en kies Afbeelding opmaken. Klik op knop Afbeelding in het taakvenster en verschuif de positie van de afbeelding in de x-as of de y-as onder bijsnijden.


14 januari 2021

Blog articles in a Word document - year 2020

It is always handy to have a printable copy of interesting articles. I have made a Word document containing all my blog articles over the past year.

Some general articles or general announcements have been left out. Articles referring to previous blog years have also been let out.

Every article has its own page, and there is a table of contents to get quickly tp it. You will see the versions of PPT that can be used to perform a task. Of course some articles only apply to a particular version of PowerPoint.

Be aware that videos are placed as a picture in the text, you will have to access the blog to view them.

You can download the document using the following link:

Blog articles, year 2020

10 januari 2021

Blogartikelen in een Word document - jaar 2020

Het is altijd handig om een geprinte versie van artikels bij de hand te hebben.

Algemene artikelen of aankondigingen zijn niet opgenomen in het document. Dat is ook geldig voor de artikelen met verwijzing naar Word documenten van vorige blog jaren.

Ieder artikel krijgt zijn eigen pagina. Een inhoudstafel is beschikbaar en je kan zien welke versies van PPT geschikt zijn om een taak uit te voeren. Sommige artikelen zijn natuurlijk enkel bestemd voor een specifieke PPT versie.

Bij ingevoegde video's moet je er rekening mee houden dat er enkel een afbeelding van de video is opgenomen in de tekst. Wil je de video echt bekijken dan ga je het relevante artikel moeten bekijken in de blog.

Je kan het document voor het jaar 2020 downloaden via onderstaande link.


Blogartikelen jaar 2020

06 januari 2021

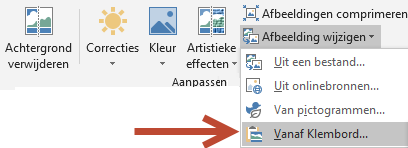
Optie afbeelding wijzigen uitgebreid met klembord mogelijkheid - PPT 2019

Soms ontdek je kleine wijzigingen in het programma toevallig. Niet lang geleden wilde ik een afbeelding vervangen door een andere en merkte ik dat de optie Vanaf Klembord is toegevoegd aan de knop Afbeelding wijzigen onder Hulpmiddelen voor afbeeldingen, tabblad Opmaak.


De optie zal natuurlijk grijs staan als er eerder niets aan het klembord toegevoegd is.


22 december 2020

Combine several audio clips with audacity and use as background sound in PPT 2019

In earlier versions of PPT one could use a Windows Media Player playlist to use as background music for a presentation. Starting with version 2016 this is no longer possible. See my previous article:

Use a WMP playlist in PPT

Here's an alternative using the free audio editing app Audacity. There are several ways to do this in Audacity this is just what I use.

Start Audacity
Click File, Import and select your audio clips. Use ctrl+click to select several. Click Open.
Both clips are neatly arranged one below the other.

Press CTRL+A to select both clips and click Tracks and choose Align tracks and then Align End to End.

Both clips are now aligned.


Finally go to File again and choose Export, Export as MP3 or another format of your choice. Select the folder and give the file a new name. Click Save.

A warning dialog appears reminding you that both clips will be mixed and saved as one clip. Click OK.


Change the metadata if needed and click OK.

When you open the new file in Audacity you will see that both clips are now just one clip.


Now you can use the mixed clips as one clip in your PPT presentation.

If you want guidance to do this see this article:

Play audio across slides


12 december 2020

Meerdere audiofragmenten combineren met Audacity en afspelen op de achtergrond in PPT 2019

In vorige versies van PPT kon je een afspeellijst van Windows Media Player gebruiken als achtergrondmuziek bij een presentatie. 

WMP (Windows Media Player) afspeellijst gebruiken in PPT 2013

Vanaf versie 2016 is dit blijkbaar niet meer mogelijk. Hier is een alternatief dat gebruik maakt van het gratis audio editeerprogramma Audacity.

Je kan op verschillende manieren tewerk gaan in Audacity, dit is hoe ik het aanpak om een aantal audiobestanden aan elkaar te hangen.

Start Audacity
Klik op Bestand en kies Importeren,  Audio, selecteer je clips (gebruik CTRL+klik voor meerdere bestanden) en klik Openen.

In mijn geval staan beide muziekbestanden nu netjes onder elkaar. 

Druk CTRL+A om alle bestanden te selecteren en ga nu naar Tracks en kies voor Tracks uitlijnen en vervolgens Einde op einde Uitlijnen.

Beide bestanden zijn nu uitgelijnd.


Ga ten slotte terug naar Bestand en kies Exporteren en vervolgens Exporteren als MP3 of een ander formaat. Kies de juiste map en geef een nieuwe naam aan het bestand, klik Opslaan
Een waarschuwing verschijnt dat de bestanden zullen geëxporteerd worden als één bestand. Klik OK.


Verander eventueel de metadata en klik OK.

Wanneer je het nieuwe bestand opent in Audacity zie je dat de twee bestanden aan elkaar zijn gezet.


Je kan nu het nieuwe audiobestand gebruiken in PPT als achtergrond voor je presentatie.

Zie daarvoor een eerder artikel:

Muziek afspelen over meerdere dia's


05 december 2020

"Breakpoint" (free) new add-in from Presentation Point

Presentation Point is a Belgian company who specializes in marketing software solutions that add functionality to PowerPoint.  Presentation Point makes life of professional presenters easier and more productive.

The first product they marketed Datapoint for example shows real-time data on a information screen. Many new products have followed, some of them free like ShowPoint and PlanPoint.

With a little effort from you, the company offers this free add-in that does exactly what its name suggests, create a slide announcing a pause. 

Update (november 2024):
Unfortunately the company has decided 
to only offer paid software on their website. So the following link has become redundant.

Breakpoint

What are the possibilities of this new add-in?

  1. Automatically adjusted date and time.
  2. Automatically adjustable countdown timer.
  3. Weather and temperature indication.
  4. Adding quotes of the day

      After installing you will see a new group on the Insert tab 'Breakpoint'.


      Every click on a button inserts a text box on the slide. Like all PPT text boxes, you can format them yourself according to your own wishes.

      This is how the options look for the Date and Clock buttons in this sample slide, you can choose the short/long date or the short/long time:


      For the weather you get this result:


      Attention! For the weather icon and the temperature you need to make sure that your location is shared in the Windows settings. The add-in uses the GPS coordinates for this. So if necessary go to Windows button - Settings - Privacy - Location if the button doesn't seem to work.


      With the quote function you can show an appropriate quote from the different categories that are offered. The quote can be updated at the start of the slide.


      The best feature is undoubtedly the countdown timer. You can set it yourself completely. Very useful and a feature I've been waiting for in PowerPoint for years.


      This is a very handy add-in, easy to use, robust. Recommended.

      01 december 2020

      "Breakpoint" (gratis) nieuwe add-in van Presentation Point

      Presentation Point is een Belgisch bedrijf dat al 20 jaar gespecialiseerd is in het op de markt brengen van softwareoplossingen rond en bovenop PowerPoint die het leven voor de professionele presentator eenvoudiger en aangenamer maken.

      Het eerste product dat zij op de markt brachten DataPoint geeft bijvoorbeeld real-time gegevens weer op een datagestuurd informatiescherm. Ondertussen zijn er al veel andere producten gevolgd waarvan een aantal ook gratis worden aangeboden zoals ShowPoint en PlanPoint. 

      Mits een kleine inspanning biedt het bedrijf deze gratis add-in aan die exact doet wat de naam suggereert een dia aanmaken die een pauze aankondigt. 

      Update: (november 2024) Helaas heeft het bedrijf besloten enkel nog betalende software aan te bieden op hun website. De volgende link is dus overbodig geworden.

      Breakpoint

      Wat zijn de mogelijkheden van deze nieuwe add-in?

      1. Automatisch aangepaste datum en tijd.
      2. Automatisch instelbare countdown timer.
      3. Weer en temperatuur indicatie.
      4. Citaten van de dag

      Na installatie kan je op het lint Invoegen een aparte groep terugvinden nl. Breakpoint.


      Iedere klik op een knop plaatst een tekstvak op de dia. Zoals alle PPT tekstvakken kan je die zelf opmaken naar eigen inzicht. 

      Zo zien de mogelijkheden eruit voor de knoppen Date en Time in deze voorbeelddia, je kan kiezen voor de korte/lange datum of de korte/lange tijd:


      Voor het weer ziet het er zo uit:


      Opgelet! Voor het weericoontje en de temperatuur moet je zorgen dat je locatie wordt gedeeld in de Windows instellingen. De add-in gebruikt daarvoor de GPS coördinaten. Ga dus indien nodig naar Windows knop - Instellingen - Privacy - Locatie als de knop niet lijkt te werken.


      Met de citaatfunctie toon je dan weer een gepast citaat uit de verschillende categorieën die worden aangeboden.


      De beste functie is ongetwijfeld de countdown timer. Die kan je zelf volledig kan instellen. Heel handig en een functie waar ik al jaren op wacht in PowerPoint.


      Dit is een erg handige add-in, eenvoudig in gebruik, robuust. Een aanrader.


      24 november 2020

      Tekstkolommen gebruiken in tekstvakken, tijdelijke aanduidingen en vormen - PPT 2019

      Net als in Microsoft Word kan je in PowerPoint gebruik maken van tekstkolommen. Dit kan zowel in tijdelijke aanduidingen op de standaard dia-indelingen als in zelf getekende tekstvakken of zelfs in getekende vormen.

      Je kan eerst de tekst intypen en dan pas in kolommen verdelen of eerst in kolommen verdelen en dan pas intypen. Helaas is er geen mogelijkheid om de kolom zelf te beëindigen met een kolom einde zoals in Word.

      Tekstkolommen in tekstvakken

      Met je cursor in het getekend tekstvak, klik in het lint start op de knop Kolommen toevoegen/verwijderen in de groep Alinea.

      Kies voor Twee of drie kolommen.

      Zoals hieronder te zien is krijg je standaard weinig afstand tussen de kolommen.
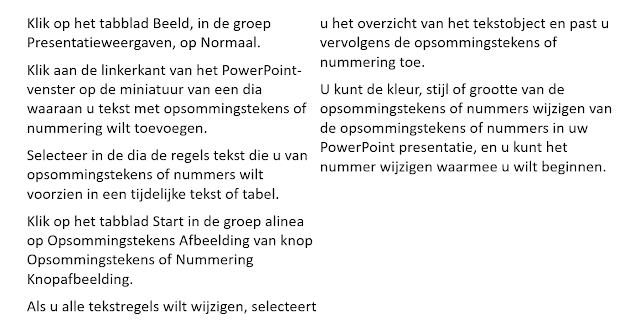
      Zelf getekend tekstvak met twee kolommen zonder extra tussenruimte

      Wil je die wel dan moet je kiezen voor de optie
      Meer kolommen en bij Afstand de ruimte instellen.
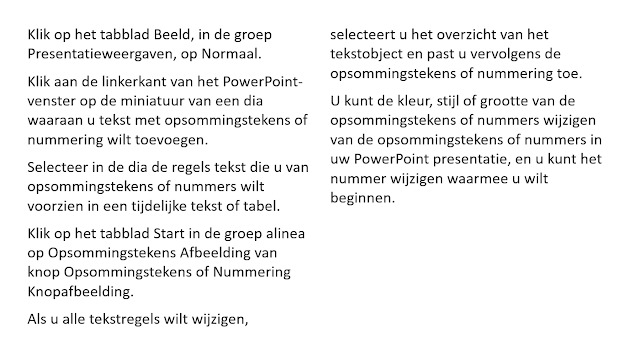

      Zelf getekend tekstvak met extra marge


      De tekengrootte bij tekstvakken is standaard 18 pt en de optie formaat van vorm aanpassen aan tekst is actief, met andere woorden het vak verhoogd naarmate er tekst wordt toegevoegd.

      Tekstkolommen in tijdelijke aanduidingen
       
      Bij tijdelijke aanduidingen op de ingebouwde dia-indelingen is de tekengrootte standaard ingesteld op 28 pt en de optie Tekst kleiner maken is actief. Dat kan tot gevolg hebben dat de tekst uiteindelijk automatisch verkleint wanneer hij niet meer past in het tekstvak. 
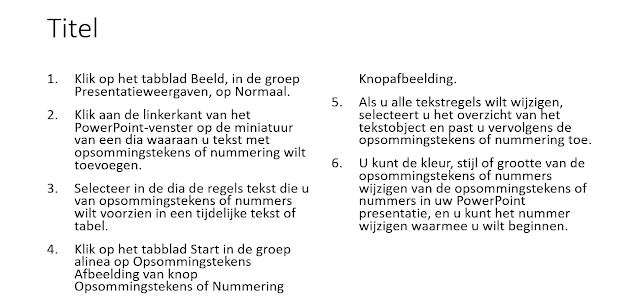
      Twee tekstkolommen in een tijdelijke aanduiding


      Zoals je ziet is de tekst automatisch kleiner geworden, in plaats van 28 pt krijg je hier nu 22 pt.

      Je kan dit voor zowel getekende als standaard tekstvakken uitzetten, klik rechts op de rand van je tekstvak/tijdelijke aanduiding en kies Positie en grootte. In het taakvenster aan je rechterkant kies je eventueel de knop Grootte en eigenschappen (1) en vervolgens klik je op het pijltje naast Tekstvak (2) en activeer je het keuzerondje AutoAanpassen niet gebruiken. Je zelf getekend tekstvak behoudt dus zijn getekende grootte en de tekst in het tijdelijk tekstvak verkleint dus niet automatisch meer.


      Tekstkolommen in getekende vormen

      Ook bij getekende vormen kan je tekstkolommen instellen. Standaard wordt ingetypte tekst verticaal en horizontaal gecentreerd in de vorm. De tekengrootte bij getekende vormen is standaard 18 pt en de optie AutoAanpassen niet gebruiken is actief, met andere woorden je kan tekst toevoegen zelfs buiten de grenzen van de vorm.


      Zie het onderstaande voorbeeld:
      Na het indelen in kolommen krijg je het volgende resultaat:

      Vooral in de cirkel is het resultaat bedroevend. Wanneer je de tekst links laat uitlijnen via de knop Uitlijnen op het lint Start valt het beter mee. Soms zal je ook de verticale uitlijning (zie afbeelding hierboven) in het tekstvak via het taakvenster vorm opmaken op Boven moeten instellen. Bij de cirkel blijft het resultaat problematisch. Komt daarbij ook dat je in PPT de woorden niet kan afbreken wat bij langere woorden aanleiding geeft tot afgebroken woorden en grote witruimten.


      Hieronder een paar voorbeelden waar gebruik is gemaakt van tekstkolommen.
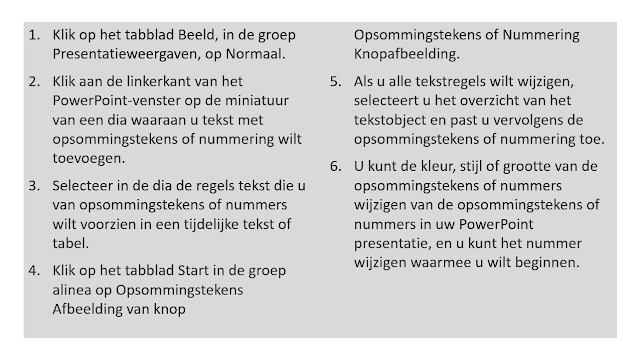
      Opgesomde tekst in zelfgetekend tekstvak met twee kolommen


      Twee zelfgetekende tekstvakken met kolommen op een lege dia-indeling


      19 november 2020

      Use text columns in text boxes, placeholders and shapes - PPT 2019

      As in Microsoft Word you can use text columns in PowerPoint. You can do this in placeholders, in slide layouts or text boxes, you can even use them in AutoShapes.

      You can either type the text first and add the columns later or set the columns first and type the text later. Unfortunately you can't end a column like in Word where you have a column break function. 

      Text columns in text boxes

      With the cursor in the text box, click on the Add columns button in the Paragraph group of the Home tab.

      Choose Two or Three columns.


      As you can see in the example below there is not enough space between the columns:

      If you want extra space between columns you have to choose More columns item at the bottom and adjust the spacing.


      User drawn text boxes by default have a font size of 18 points, the option to resize shape to fit text is active. In other words the box will expand as you type text in it.

      Text columns in placeholders

      Same procedure as above. With placeholders the default font size is 28 points and the option Shrink text on overflow is active. This means that text will automatically be reduced in size when it no longer fits in the placeholder. Shrink to fit can lead to different text sizes on consecutive slides which does not look professional.

      Numbered paragraphs in a two column placeholder


      As you can see the text has been reduced automatically to a size of 22 points.

      You can change the defaults by right-clicking the placeholder/text box and choose Size and position. In the taskpane click the Text options button. Under Tex box check the radio button Dot not autofit. The text box you draw retains its original shape and the text in the placeholder will not shrink. As a bonus you will not type too much text in a placeholder, which is never a good idea in PPT.


      Text columns in Auto Shapes

      If you use columns in AutoShapes you will need some extra formatting to get what you want. By default text is horizontally and vertically centered in shapes. AutoShapes by default have a font size of 18 points, the option Do not Autofit is active. In other words you will be able to type as many text you want even if it exceeds the limits of the shape.


      As you can see in the following example this can be a problem especially in the circle.
      When you align the text to the left using the Align button on the Home tab results are better. You will also have to align the text vertically. Using the format shape task pane you can align the text at the top of the shape. 
      The circle shape still is not perfect though and will require a reduced font size. The problem gets worse with long words, PPT does not allow hyphenation so you may end up with broken up words or very large gaps between words.
      .


      A few examples of text columns:

      Numbered paragraphs in a two column text box


      Two text boxes with text columns